
How Hot Is India Getting?
ISignal Data Tracker
India is getting hotter. But where, and how fast?
Explore temperatures and extreme heat across India's states and districts using ERA5 climate data.
Try Goa · Maharashtra · or open the full-screen Atlas
India: Days ≥ 40 °C
Tap a region for its value. Click a region for its value, then open its page. ERA5 is a reanalysis estimate on a ~28 km grid, so district values are smoothed. ERA5 © C3S/ECMWF · boundaries © geoBoundaries. Boundaries are not official Survey of India boundaries.
Insights
Values come from ERA5, a global climate reanalysis, mapped onto state and district boundaries. This is not a forecast and not an official heatwave warning.
Data through 2026-10-24 (full years to 2025; 2026 is partial) · ERA5 reanalysis · release 2026-10-31-f8bb6a6 · updated 2026-10-31
Warmest full year
2024
India average 23.3 °C, of 2020–2025
Days ≥ 40 °C in 2025
12.6
average across India's area, against 16.1 in 2020–2024
Data coverage
2020–2026
2026 is partial, through 24 Oct 2026
Quick answers
Computed from the data on this site, 2026 so far (1 January–24 October 2026). See full rankings and download the data.
Which states had the most days above 40 °C in 2026?
Counts of days when the ERA5 daily maximum reached 40 °C or more, averaged over each state. 2026 so far (1 January–24 October 2026).
- 1Rajasthan2020–2025 average for the same days: 44.650.7 days
- 2Haryana2020–2025 average for the same days: 30.534.2 days
- 3Madhya Pradesh2020–2025 average for the same days: 23.330.2 days
- 4Uttar Pradesh2020–2025 average for the same days: 24.129.0 days
- 5Maharashtra2020–2025 average for the same days: 19.529.0 days
Which districts were hottest in 2026?
Highest counts of days at or above 40 °C. District values are smoothed by the ~28 km grid.
- 1Jaisalmer, Rajasthan92.2 days
- 2Bikaner, Rajasthan87.3 days
- 3Churu, Rajasthan67.8 days
- 4Batod, Gujarat66.7 days
- 5Barmer, Rajasthan63.1 days
Where did 40 °C days rise the most compared with earlier years?
Difference from the 2020–2025 average over the same calendar days. A short window, not a long-term trend.
- 1Maharashtra29.0 vs 19.5+9.5 days
- 2Chhattisgarh25.5 vs 17.9+7.5 days
- 3Telangana21.5 vs 13.9+7.5 days
- 4Madhya Pradesh30.2 vs 23.3+6.9 days
- 5Rajasthan50.7 vs 44.6+6.1 days
Latest climate reporting from ISignal
View all articles →
Climate Change · 29 Oct 2026
Invisible and Unprotected: India’s New Labour Codes Fail Domestic, Home-Based Workers
Development · 22 Oct 2026
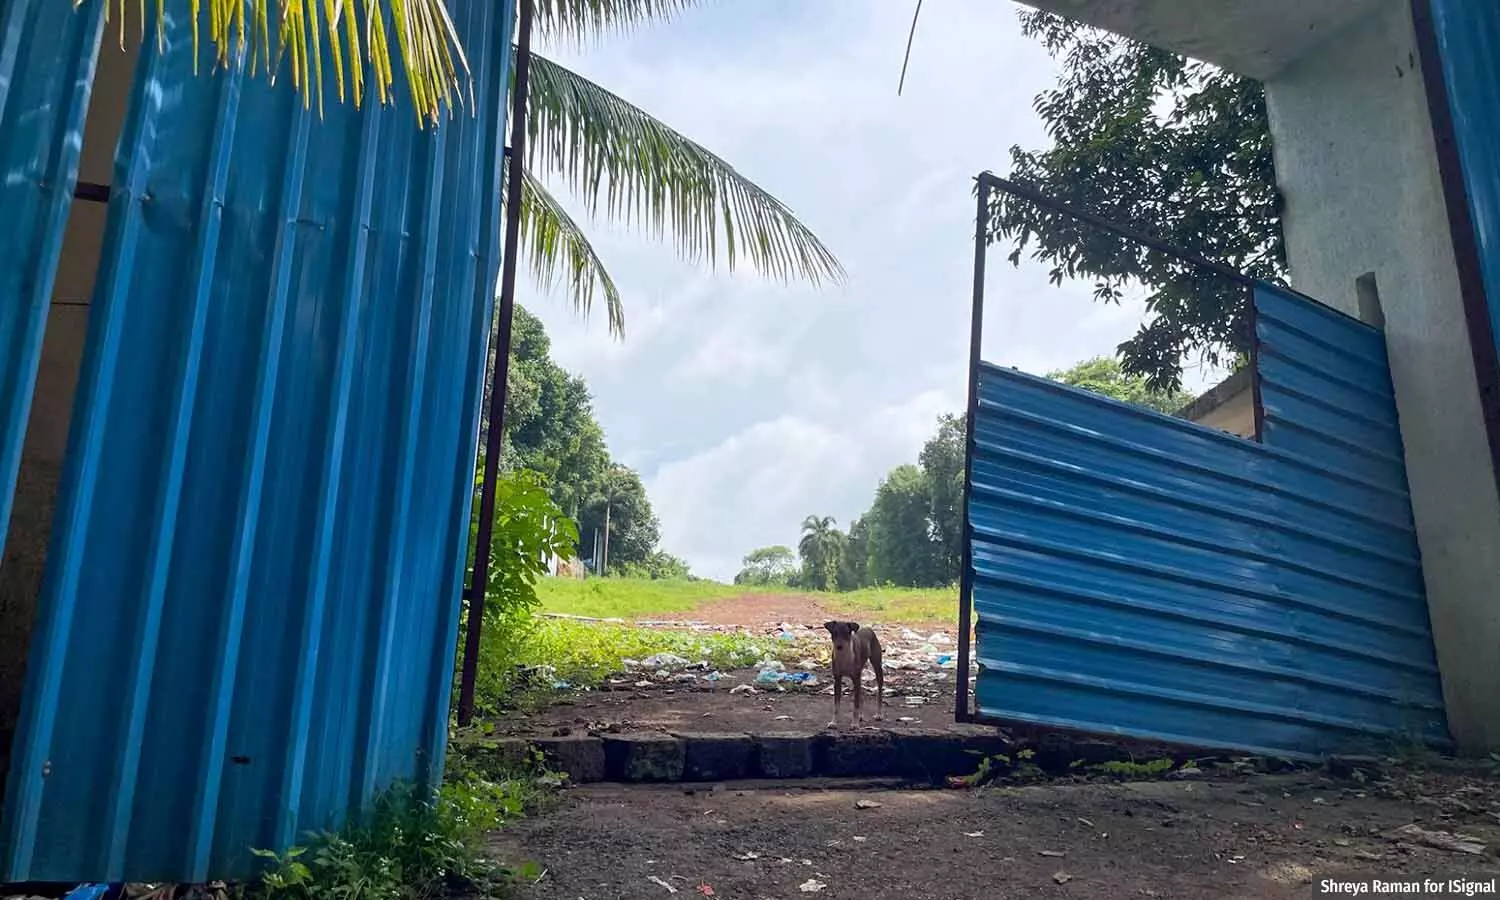
In Goa, Real Estate Land Grab Threatens Protected Eco-Sensitive Slopes
Earthcheck India · 14 Oct 2026
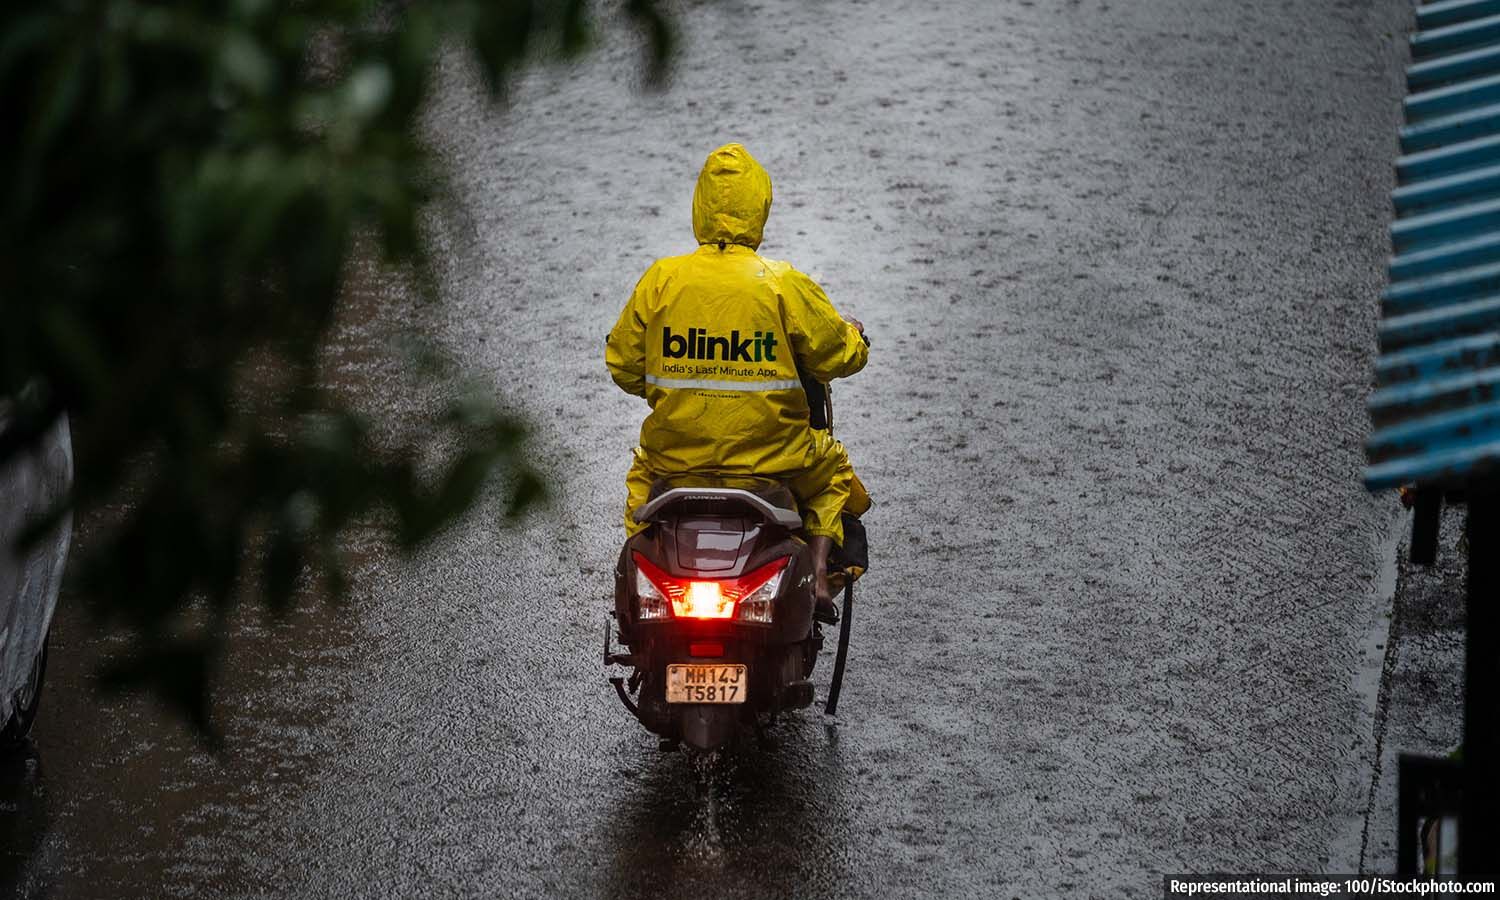
Why Gig Workers Can't Choose Working Hours Even In Extreme Weather
Read this before sharing a number
What ERA5 is
A reanalysis: a weather model constrained by observations. It is not a thermometer reading, and it can understate local extremes.
What days ≥ 40 °C means
Counts grid-cell days with a modelled daily maximum of at least 40 °C. IMD heatwave declarations use station data and regional criteria, so the two are different things.
About the data
The grid is about 28 km wide, so small districts and islands may be covered by only part of one cell. District values are smoothed. Boundaries are not official Survey of India boundaries.